The challenge

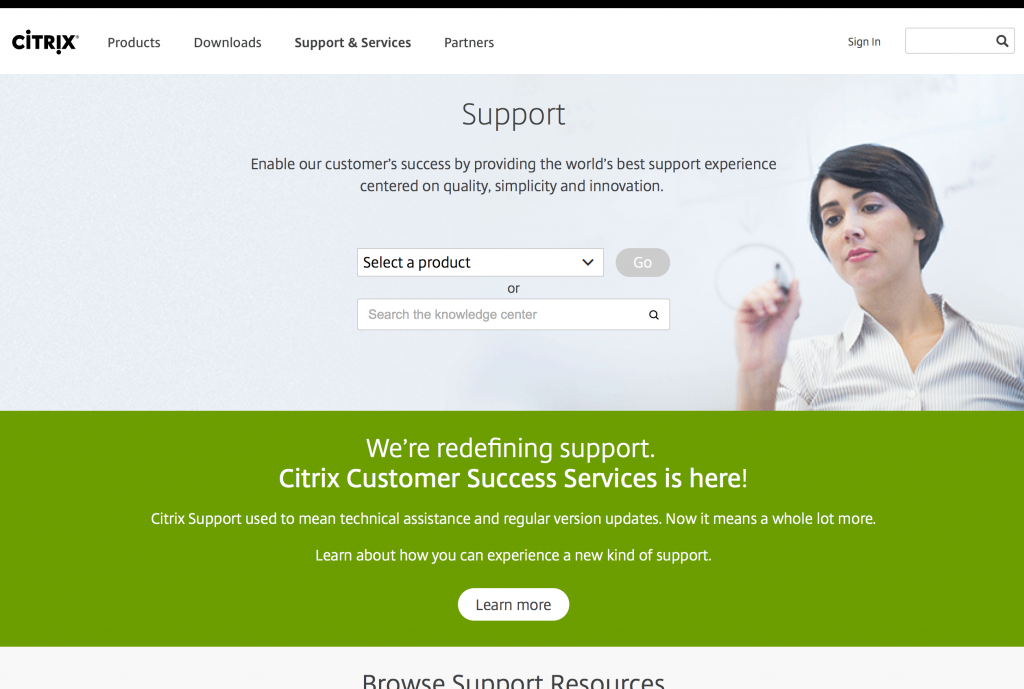
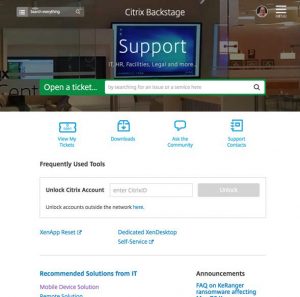
A large portion of support calls could be easily resolved with available DIY content that users were unable to find leading to high operating costs. At the same time the company wanted to drive the adoption of new paid support programs.

The goals

  • Reduce support call volume to reduce operating costs
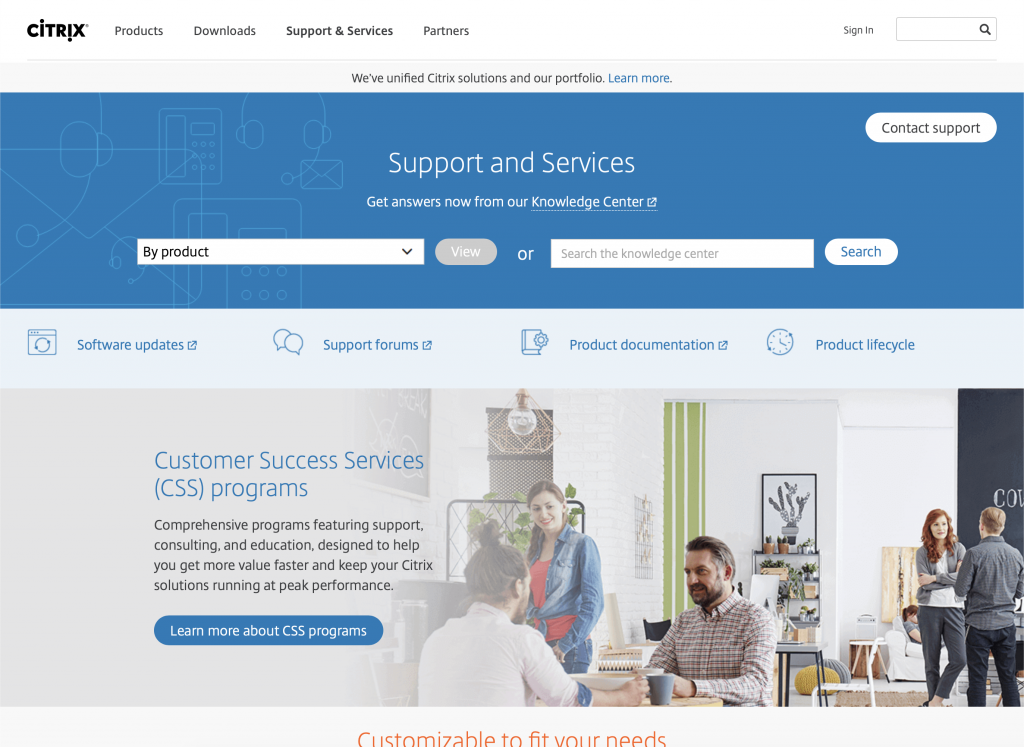
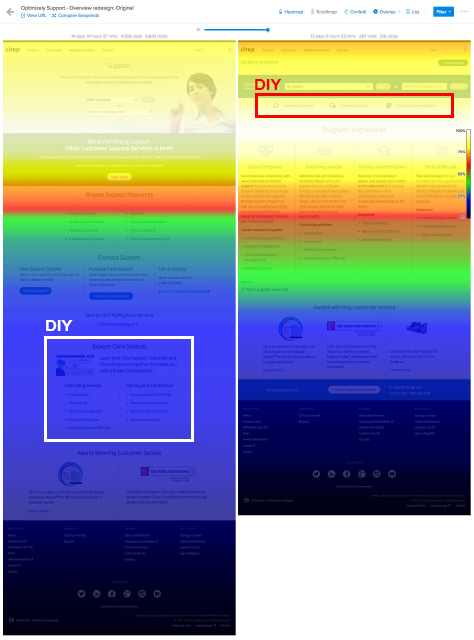
  • Increase traffic to DIY content spread across several locations
  • Increase traffic to paid support program content

Hypothesis

Bias toward action, then with sales

We believed that if we could provide obvious and easy access to do-it-yourself (DIY) content that customers, including those with paid support plans, would prefer to resolve their issues on their own.

User research

During multiple focus group and individual interview sessions, people reported that they preferred to resolve issues on their own. Calling for support, even if they had a support contract, was an option of last resort. they also reported just a handful of critical tasks that they dealt with on a regular basis.

Review of analytics and heat maps reveled that few people scrolled past what they saw on page load. Most of the DIY content was below the average fold, out of sight.

Process

Identify, and design for, the job to be done (JTBD)

Findings were worked into JTBD (Jobs to be done) stories. Stories were prioritized based on Opportunity Score, business goals and user needs. They where then reviewed and approved with the team before design began, resulting in minimal internal debate later in the process. Low-fidelity prototypes were created and tested before committing to the solution.

Citrix Support landing page

Before

The over-sized header image pushes most DIY content is below the fold reducing engagement since few visitors are scrolling. 

After

Removing the header image allowed placing critical DIY content at the top making it obvious and easy to access.

Scroll maps

Less than 10% ever saw the DIY content in the original design (left) compared to 100% seeing the DIY content in the new design.

The results

  • 262% average increase in DIY tool usage (106% to 368% increase across 5 tools)

  • 51% deflection rate ($118M cost avoidance in 12 months)

  • 27% average increase in traffic to content (46% increase to paid support program content)

  • 39% growth of paid support programs in 2017

  • Support attach rate increased from 35% to 91% after launch